Creating a chart with angular.js and postgresql
January 9 2015
Today I had to deal with a couple different interesting problems when using Angular.js to interact with a postgresql database. I’m not normally a Javascript guy, or for that matter a UI guy either, so I ran into a few complications along the way, and I thought they were worth documenting.
I’m essentially implementing a line chart depicting totals of items as they change over time, according to type, like the result here:
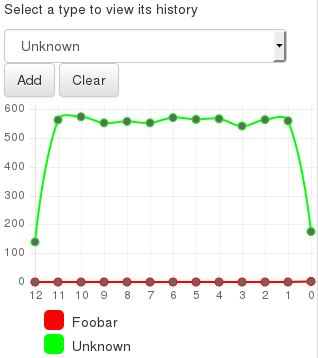
The user can choose types to add to the chart and compare. They can specify any valid type, including no type known, or null.
Where NULL is NULL
Since I’m more familiar with the back-end here, I started with the query I needed to generate the results in the chart. There’s an interesting little quirk of SQL syntax here, because “null” is a valid value. Normally this sort of query is fairly straight-forward, e.g.:
select * from table where value = ?
The problem, however, is that this query will not work when the value specified by the user is null. Because “null” always represents an unknown, SQL syntax means that, when called with null, this where clause will always produce no results even if value is sometimes null. Getting results in that case requires the ‘is null’ syntax instead. I’m averse to managing multiple versions of the query (or altering it dynamically) in order to switch based on the value provided, so how do I account for this? I ended up putting a second condition on the query:
select * from table where value = ? or (value is null and ? is null)
I’m amused by how this resolves: “… where value = null or (value is null and null is null)”.
Aggregating Asynchronous REST calls
Having made my query function as expected, I encountered another difficulty when attempting to depict it in a graph. The graph may contain the result of multiple executions of the query, so it needs to be drawn only when all required results are available. Worse, the query results themselves don’t contain everything the graph needs, so extra information needs to be passed along to the final callback.
for (var i = 0; i < list.length; i++){
	History.query({ type: list[i] },
	function(result){
	  drawGraph(result);
	});
}
Doesn’t work because it would invoke drawGraph for every query, ultimately only showing results for whichever result comes in last.
I improved this by using $q.all() to catch when all results finalize:
var promises = [];
for (var i = 0; i < list.length; i++){
	promises.push(History.query({ type: list[i] });
}
$q.all(promises).then(function (result){
	drawGraph(result);
});
Adding context to results
This leaves one remaining problem - the query concerned doesn’t return the type with which it was invoked. Since it would by definition be identical for all rows returned, and then identical to the initial query, it’s silly to include it in the results. But if the callback only includes one parameter with the database results, how do I add additional context to its invocation?
The solution I came up with is using the bind method:
var promises = [];
for (var i = 0; i < list.length; i++){
	promises.push(History.query({ type: list[i] });
}

var callback = function(types, result){
	drawGraph(types, result);
}.bind(undefined, list);
$q.all(promises).then(callback);
The end result is that the callback is invoked with the original list of types as a parameter, which can then be used to populate the legend on the graph. The assumption used here is that the order of results in the callback function will match the order in which the promises were specified to $q.all. Given this, type[x] corresponds to result[x] for all valid x. This correlation appears to be true, but further research is required.